
An Actionable Dashboard for Tax Loss Harvesting
How Harvest IY rebuilt its dashboard as an actionable task list: Harvestable Losses, Wash Sale Warnings, and positions that Need Attention.
Posted by
AWAndrew Weiner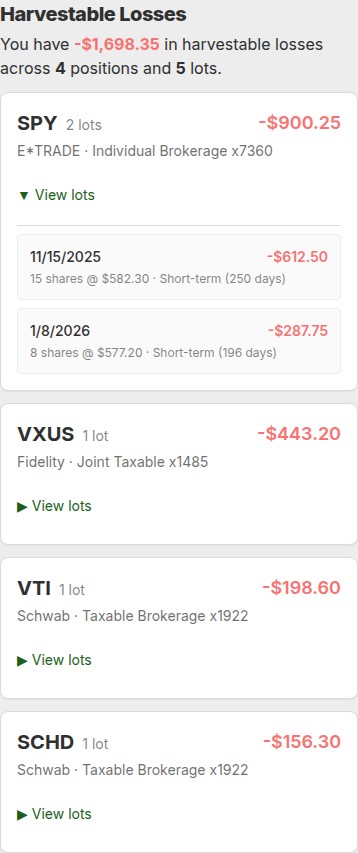
The Problem with Old-School Dashboards
A few weeks ago I logged into the old Harvest IY dashboard and stared at it for a minute. Positions, P/L columns, account totals. All the numbers were right. And I had no idea what I was supposed to do with any of them.
That is the problem with most finance dashboards. They are built around the data the system happens to have, not around the question the user actually walked in with. And the question is almost never "please describe my entire portfolio in tabular form." The question is: What should I do next?
The Reframe: What Should I Do Next?
So we threw out the old dashboard and started over from a single design rule: every section on the page has to answer "what should I do next?" in plain English. If a section can't answer that question, it doesn't belong on the dashboard.
An actionable dashboard is a task list, not a spreadsheet.
The UX design term for this is task-based UI: an interface organized around what the user needs to do, rather than around the data the system happens to store. It is common in project management tools and support software. It is rare in finance.
That reframe ended up changing almost everything: the layout, the copy, the navigation, even which API endpoints get called on page load. What we landed on is three sections, each one a list of things you can act on right now.
The New Layout
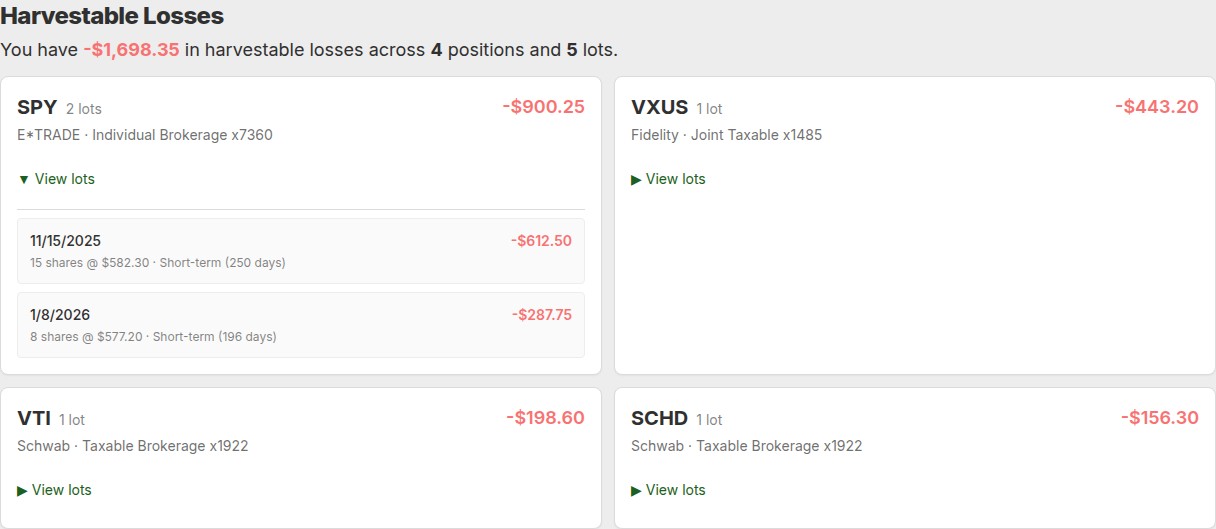
The new dashboard has three sections. Each one is a card grid: one column on mobile, two columns on a wider screen.
Harvestable Losses
This is what you came here for: lots that might be worth harvesting. They are grouped by symbol and account, with the total unrealized loss per group. Expand any group to see each individual lot: quantity, price, acquired date, holding period, and whether the capital loss would be short-term or long-term.
Wash Sale Warnings
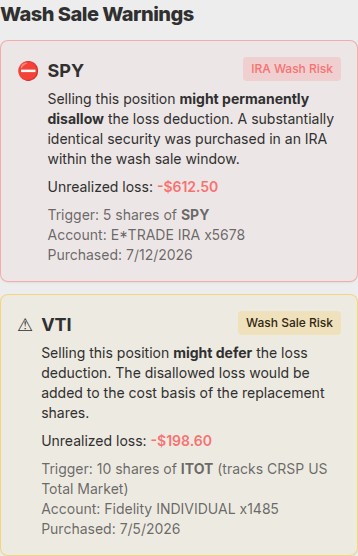
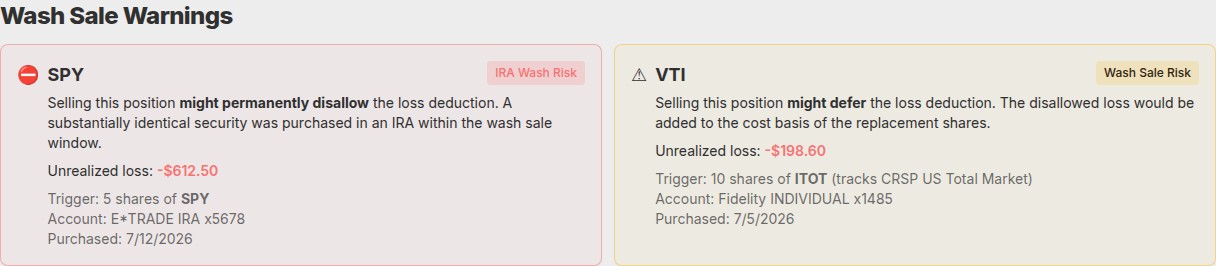
The other side of harvesting. The IRS disallows a capital loss if you (or your spouse, or a retirement account in your household) buy a substantially identical security within 30 days before or after the sale. So Harvest IY checks for this: for each lot you could harvest, we flag whether selling it today would trip that rule because of a recent purchase somewhere else in your accounts.
If the replacement shares are in a regular taxable account, the loss is not lost, just deferred: it gets added to the replacement shares' cost basis, and you recover it when those shares are sold down the road. If the replacement shares are in a tax-advantaged account like an IRA or 401(k), the loss is permanently disallowed, because the cost basis adjustment does not work inside tax-advantaged accounts. The dashboard flags both cases, with the tax-advantaged case marked more severely. You see the risk before you click sell, not after.
Needs Attention
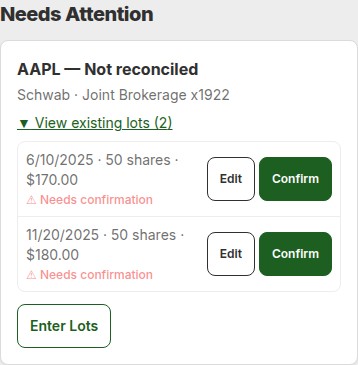
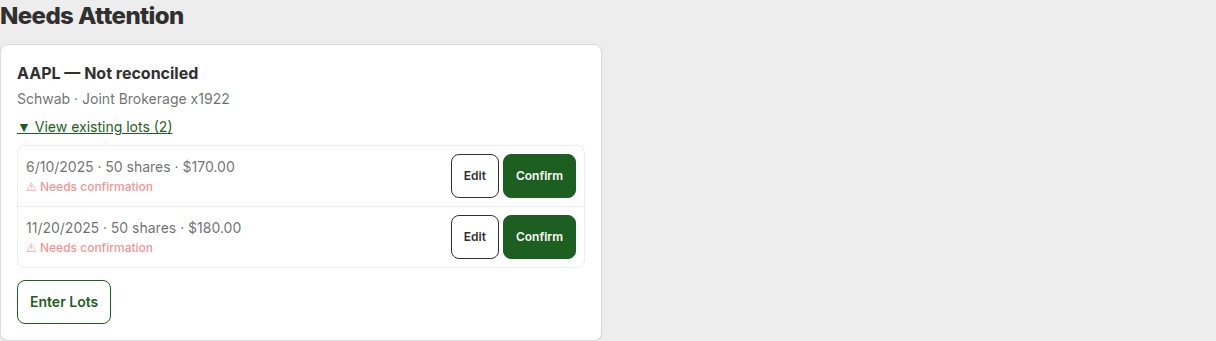
The housekeeping section. Brokerages do not always expose lot data cleanly through their APIs, so sometimes Harvest IY has to infer lots from your transaction history, and sometimes that inference produces lots that you, the human, need to correct. Each card here has a Confirm or Edit button per lot. Tax loss harvesting only works if the underlying lot data is right, and this is how we keep it right without burying you in spreadsheets.
This section also surfaces disconnected brokerage connections. If a connection goes stale (expired credentials, a required re-authorization), Harvest IY flags it here so you can reconnect and keep your data flowing.
Every section follows the same pattern: each card answers one question and has at most one or two buttons. No giant tables. No twelve-column grids. No "customize columns" menus.
Built for Your Phone
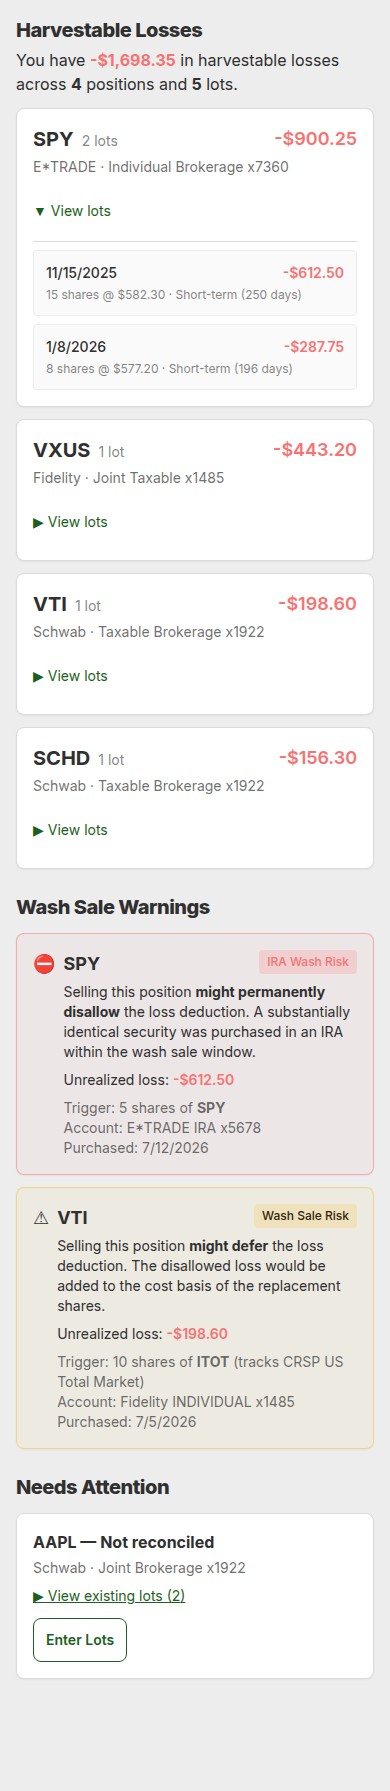
The common flow on Harvest IY looks like this: we email you about a tax loss harvesting opportunity, or a brokerage connection that needs attention. You read that email on your phone. From the email, you tap through to the dashboard.
That means the dashboard has to work well on a phone screen. The card you tap into from the email needs to be readable. The action buttons need to be tappable with your thumb while bouncing around on the subway. The card details need to fit without horizontal scrolling. There is no "please rotate your phone" cop-out and no "best viewed on desktop" banner.
Concretely: 44px touch targets (Apple's recommended minimum for tappable elements), responsive 1-column-on-mobile / 2-column-on-desktop grids, mobile-first navigation. Most tax and finance software still treat mobile as a second-class citizen. For an alert-driven product like Harvest IY, we are going to keep prioritizing the mobile experience.
Try It
If you already have a Harvest IY account, log in and check out the new dashboard. The next email alert you get will drop you straight into it.
If you don't have an account yet: Harvest IY watches your brokerage portfolio for tax loss harvesting opportunities and emails you when there is something worth looking at, so you don't have to remember to check. Think of it as a wake-me-when-it-matters service for tax loss harvesting.
More posts coming soon, including the messy reality of inferring tax lots from brokerage transaction data, and a tool we developed to help you estimate your potential tax savings from tax loss harvesting.